PreFigure for creating tactile mathematical diagrams
David Austin, Grand Valley State University
Alexei Kolesnikov, Towson University
Tactile Reading and Graphics Conference
June 3, 2025
Slides at gvsu.edu/s/3cD
What is PreFigure?
PreFigure is an authoring system for creating accessible mathematical diagrams. PreFigure is to figures what PreTeXt is to text.
Open source and freely available.
Write once, read everywhere. From the same source, PreFigure creates
annotated SVG for HTML,
PDF for print,
tactile graphics for embossing,
more ….
Annotated diagrams
Diagram Exploration Keyboard Controls
Tactile graphics
Foreground components have a clear outline.
MathJax produces mathematics in Nemeth Braille.
Labels are rendered in the Braille29 font to facilitate embossing.
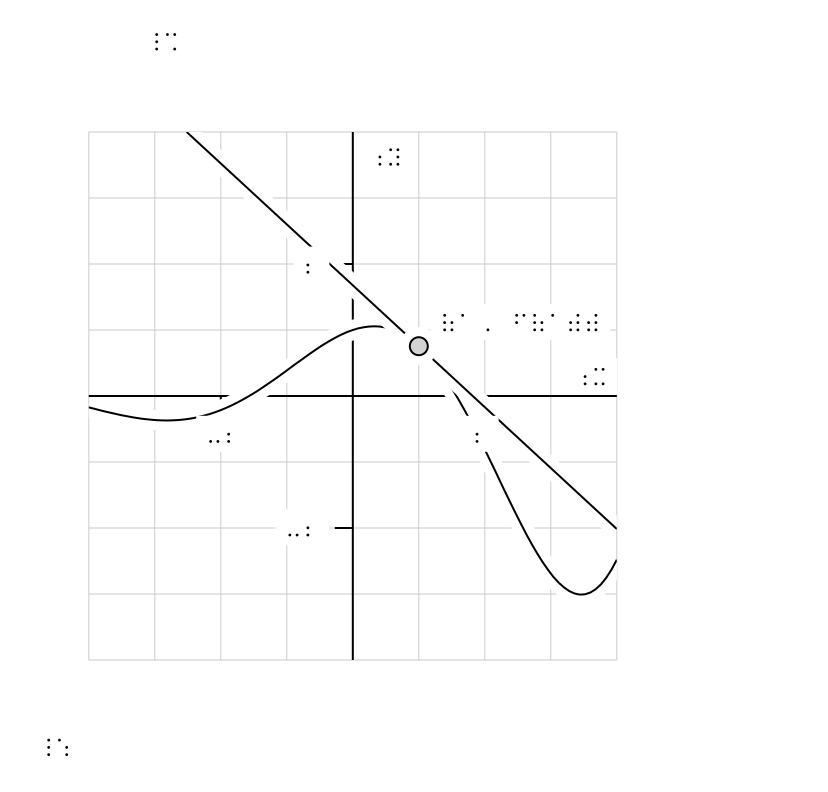
Anatomy of a PreFigure diagram
<diagram dimensions="(300,300)" margins="5">
  <definition>a=1</definition>
  <definition>f(x)=exp(x/3)*cos(x)</definition>
  <coordinates bbox="[-4,-4,4,4]">
    <grid-axes xlabel="x" ylabel="y"/>
    <graph function="f"/>
    <tangent-line function="f" point="a"/>
    <point p="(a, f(a))">
      <m>(a,f(a))</m>
    </point>
  </coordinates>
</diagram>
Getting started with PreFigure
PreFigure playground, thanks to Jason Siefken, gvsu.edu/s/35f.
PreFigure codespace, gvsu.edu/s/35e
Install locally from instructions at prefigure.org
Your turn
PreFigure documentation: prefigure.org
In the Playground, (gvsu.edu/s/35f) modify the original diagram:
Change the aspect ratio with
dimensions="(300,200)"Change the bounding box with
bbox="(-1,-2,4,5)"Change the function
for the pointawhere the tangent line is drawn.Add another function and include
stroke="green".Add another point with a label.
Recreate one of the tactile samples.
Explore samples in the
Exampleslink.
Acknowledgment
Funding for this work was provided by the National Science Foundation, DUE IUSE #2334767, 2334768, 2334769. Any opinions, findings, and conclusions or recommendations expressed in this material are those of the author(s) and do not necessarily reflect the views of the National Science Foundation.